Inclusion Indicators
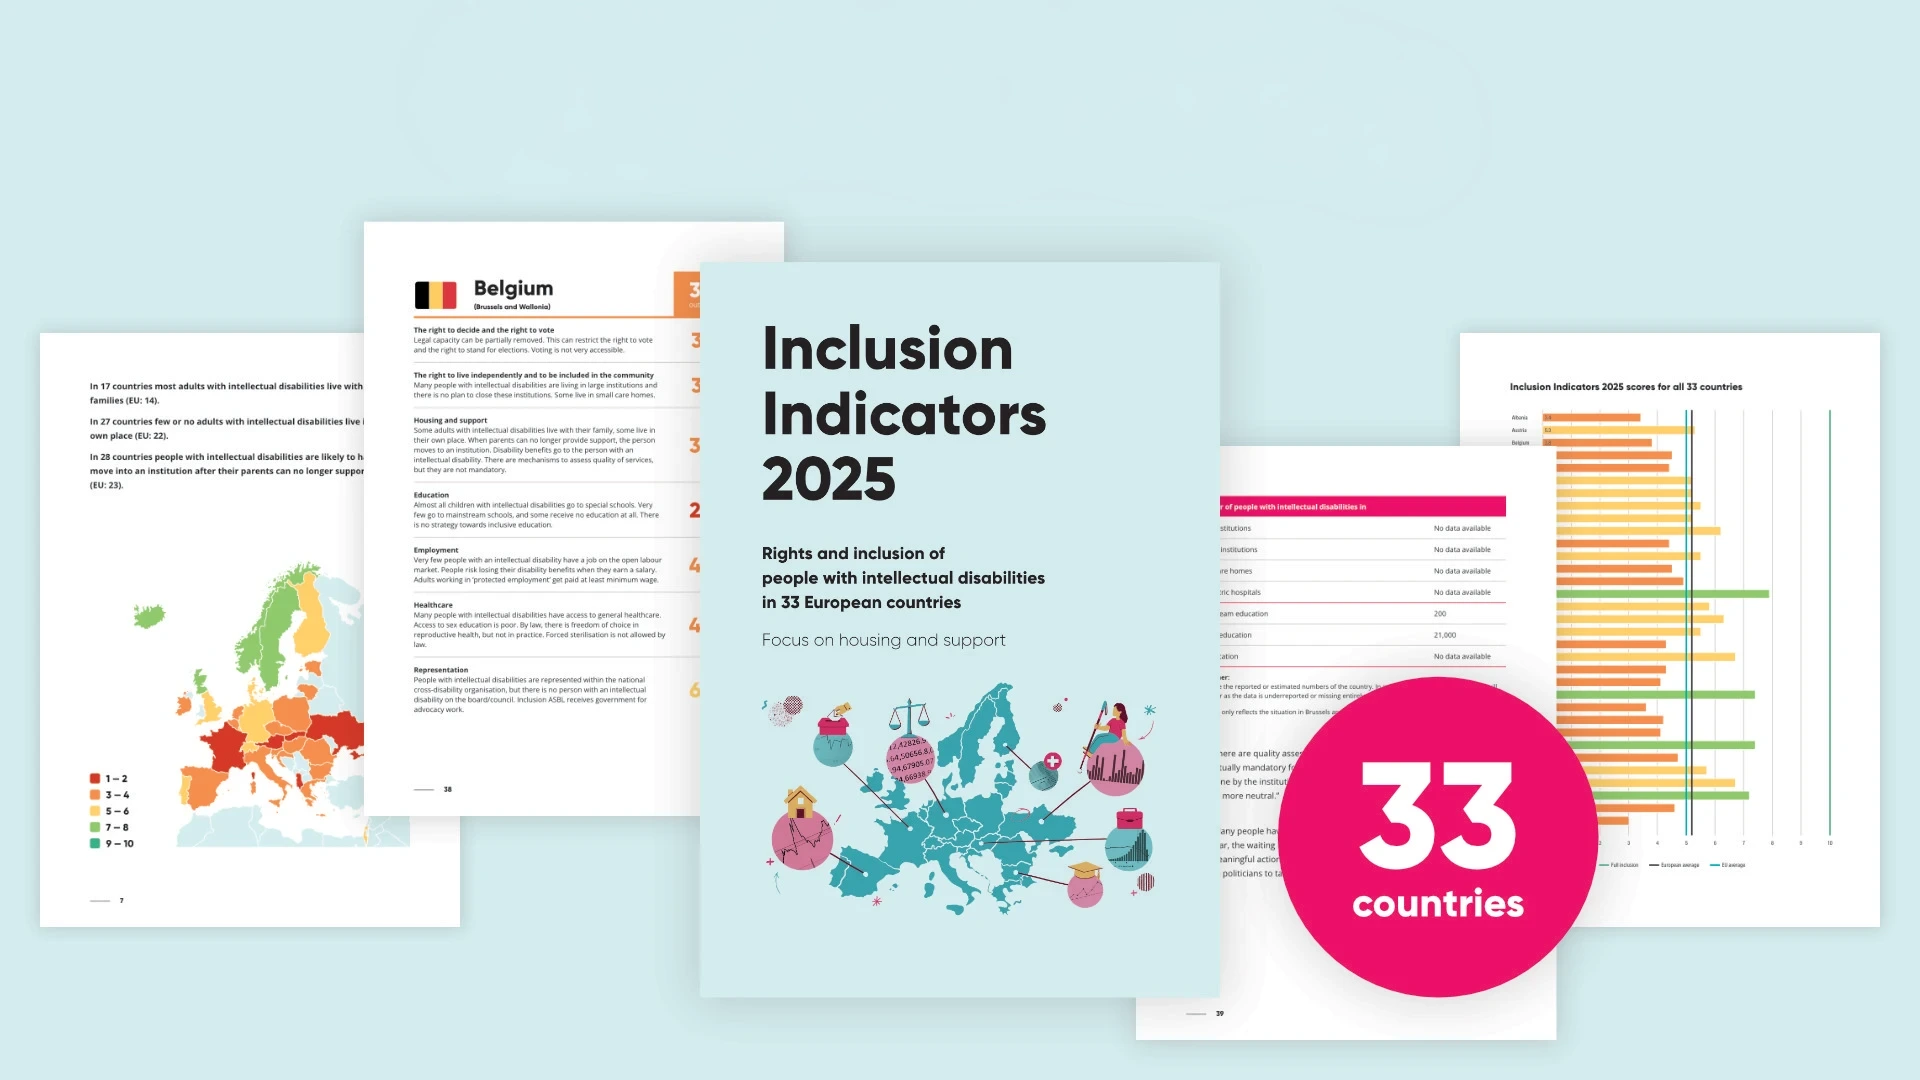
Inclusion Indicators reports show the situation of people with intellectual disabilities and their family members in Europe across 33 coutries.
Exclusive Data
Inclusion Europe conducts its Inclusion Indicators research through annual surveys filled out by its national member organisations.
Reality Check
What Europe looks like for 20 million people with intellectual disabilities and their family members.
Latest reports
We bring data to European decision makers. Using the Inclusion Indicators you can do the same in your country.

2025
33 countries covered. Plus, an extra chapter with focus on housing and support.
2024
31 countries covered. Plus, a survey of more than 400 self-advocates:
2023
This new report shows information about 29 countries, 23 of them in the EU:
Online Overview
In the table below, you can view country scores for each indicator. You can switch between different yeears, and you can click on the country for details. You can click on the arrows next to an indicator to switch country comparisons.
| Country | Average inclusion score | Right to decide and right to vote | Right to live independently and to be included in the community | Housing and support | Education | Employment | Healthcare | Representation |
|---|---|---|---|---|---|---|---|---|
| Albania | 3.4 | 1.5 | 4.7 | 2.5 | 4.2 | 3.7 | 3.6 | 3.8 |
| Austria | 5.3 | 8.6 | 3.9 | 2.6 | 6.7 | 1 | 4 | 10 |
| Belgium | 3.8 | 3.1 | 3.1 | 3.4 | 2.2 | 4.2 | 4.3 | 6.5 |
| Bulgaria | 4.5 | 1.1 | 5.2 | 4.1 | 5.6 | 2.8 | 5.8 | 6.8 |
| Croatia | 4.4 | 4.4 | 3.2 | 3.2 | 7.4 | 4.6 | 5.9 | 2.3 |
| Czechia | 5.3 | 6.6 | 4.5 | 4.9 | 5.4 | 5 | 5.6 | 4.8 |
| Denmark | 5.2 | 2.7 | 4.2 | 5.5 | 6 | 6.1 | 5.5 | 6.5 |
| England | 5.6 | 8.5 | 5.2 | 5.6 | 6.8 | 3.4 | 5.6 | 3.8 |
| Estonia | 5.2 | 3.7 | 4.2 | 4.2 | 5.8 | 4.2 | 7.6 | 7 |
| Finland | 6.2 | 7.6 | 5.8 | 6.8 | 6 | 3.6 | 7.1 | 6.5 |
| France | 5.3 | 8.1 | 2.4 | 6.2 | 5 | — | 5.7 | 4.5 |
| Germany | 5.5 | 8.6 | 3.8 | 5.7 | 5.2 | 4.1 | 5.3 | 5.8 |
| Greece | 4.5 | 1.9 | 4.7 | 4.8 | 6.8 | 3.6 | 5.7 | 4.3 |
| Hungary | 4.9 | 2.5 | 4.5 | 3.6 | 4.4 | 5.6 | 4.4 | 9.3 |
| Iceland | 7.9 | 9.8 | 9.4 | 7.1 | 6.8 | 7.3 | 7.9 | 7 |
| Ireland | 5.8 | 7.3 | 5.7 | 4.4 | 4 | 4.6 | 8.1 | 6.5 |
| Israel | 6.3 | 6.7 | 6.2 | 5.7 | 7.2 | 4.5 | 6 | 7.8 |
| Italy | 5.5 | 5.6 | 4.2 | 4.8 | 8.4 | 3.5 | 5.3 | 7 |
| Lithuania | 4.3 | 4.4 | 3.7 | 3.5 | 6.2 | 2.9 | 2.6 | 6.5 |
| Luxembourg | 6.7 | 7.3 | 6.3 | 5.2 | 6.4 | 5.5 | 7.2 | 9 |
| Malta | 4.3 | 1 | 2.8 | 3 | 7 | 6.9 | 6.4 | 3.3 |
| Norway | 7.4 | 8.3 | 8 | 8.8 | 7.6 | 5.3 | 6.9 | 7 |
| Poland | 3.6 | 2.4 | 3 | 3 | 3.6 | 4 | 4.6 | 4.5 |
| Portugal | 4.2 | 4.4 | 2.8 | 5.1 | 8.4 | 4.1 | 3.3 | 1 |
| Romania | 4.1 | 4.2 | 2.7 | 4.2 | 5 | — | 3.8 | 4.5 |
| Scotland | 7.5 | 7.7 | 7 | 8.2 | 9 | 6.1 | 6.9 | 7.3 |
| Slovakia | 4.7 | 4.7 | 2.4 | 2.6 | 5.3 | 3.3 | 5.7 | 9 |
| Slovenia | 5.7 | 6.8 | 5.7 | 4.9 | 4.6 | 5.7 | 7.7 | 4.3 |
| Spain | 6.7 | 8.4 | 4.5 | 4.5 | 7.8 | 4.8 | 6.7 | 10 |
| Sweden | 7.2 | 7.6 | 9.4 | 7.3 | 4.6 | 3.5 | 8.1 | 10 |
| Switzerland | 4.7 | 2.6 | 4.7 | 6 | 4 | 3.3 | 4.7 | 7.3 |
| The Netherlands | 4.1 | 5.4 | 2.5 | 4.5 | 2.4 | 2.9 | 4.3 | 6.8 |
| Ukraine | 3 | 2.1 | 2.3 | 2.5 | 4.2 | 2.6 | 3.5 | 3.5 |
All scores are out of 10. A dash means the indicator could not be measured that year.